Growth Charts in Avni
Introduction to Child Growth Indicators
Growth charts are essential tools for monitoring the physical development of children. They help healthcare providers assess whether a child is growing properly according to established standards.
Refer to WHO's child-growth-standards for in-depth coverage on all indicators used to assess the growth of a child. These indicators are intended for interpretation primarily by healthcare providers to:
- Investigate causes of growth problems
- Counsel caregivers on recovery
- Intervene in urgent high-risk scenarios to avert permanent damage or mortality
The child's age, sex, and measurements of weight and length or height are used to calculate the following growth indicators as per WHO standards for children aged 0 to 5 years:
- Weight-for-age (WFA): Helps identify underweight or overweight conditions
- Length/height-for-age (HFA): Helps identify stunting (low height for age)
- Weight-for-length/height (WFH): Helps identify wasting (low weight for height) or obesity
These measurements should be taken and recorded whenever an infant or child visits a healthcare provider, such as for immunization, well-baby visits, or care during illness.
Growth Chart Features in Avni
Supported Indicators
The Avni client application provides growth charts for the following indicators by default:
- Weight-for-age (WFA)
- Length/height-for-age (HFA)
- Weight-for-length/height (WFH)
Automatic Enablement
In Avni, growth chart monitoring is automatically enabled when a program with the name "Child" or "Phulwari" is created for an organization.
Manual Enablement
For any other Program, Growth Chart monitoring can be enabled by toggling the "Show Growth Chart" widget to the Program Dashboard.
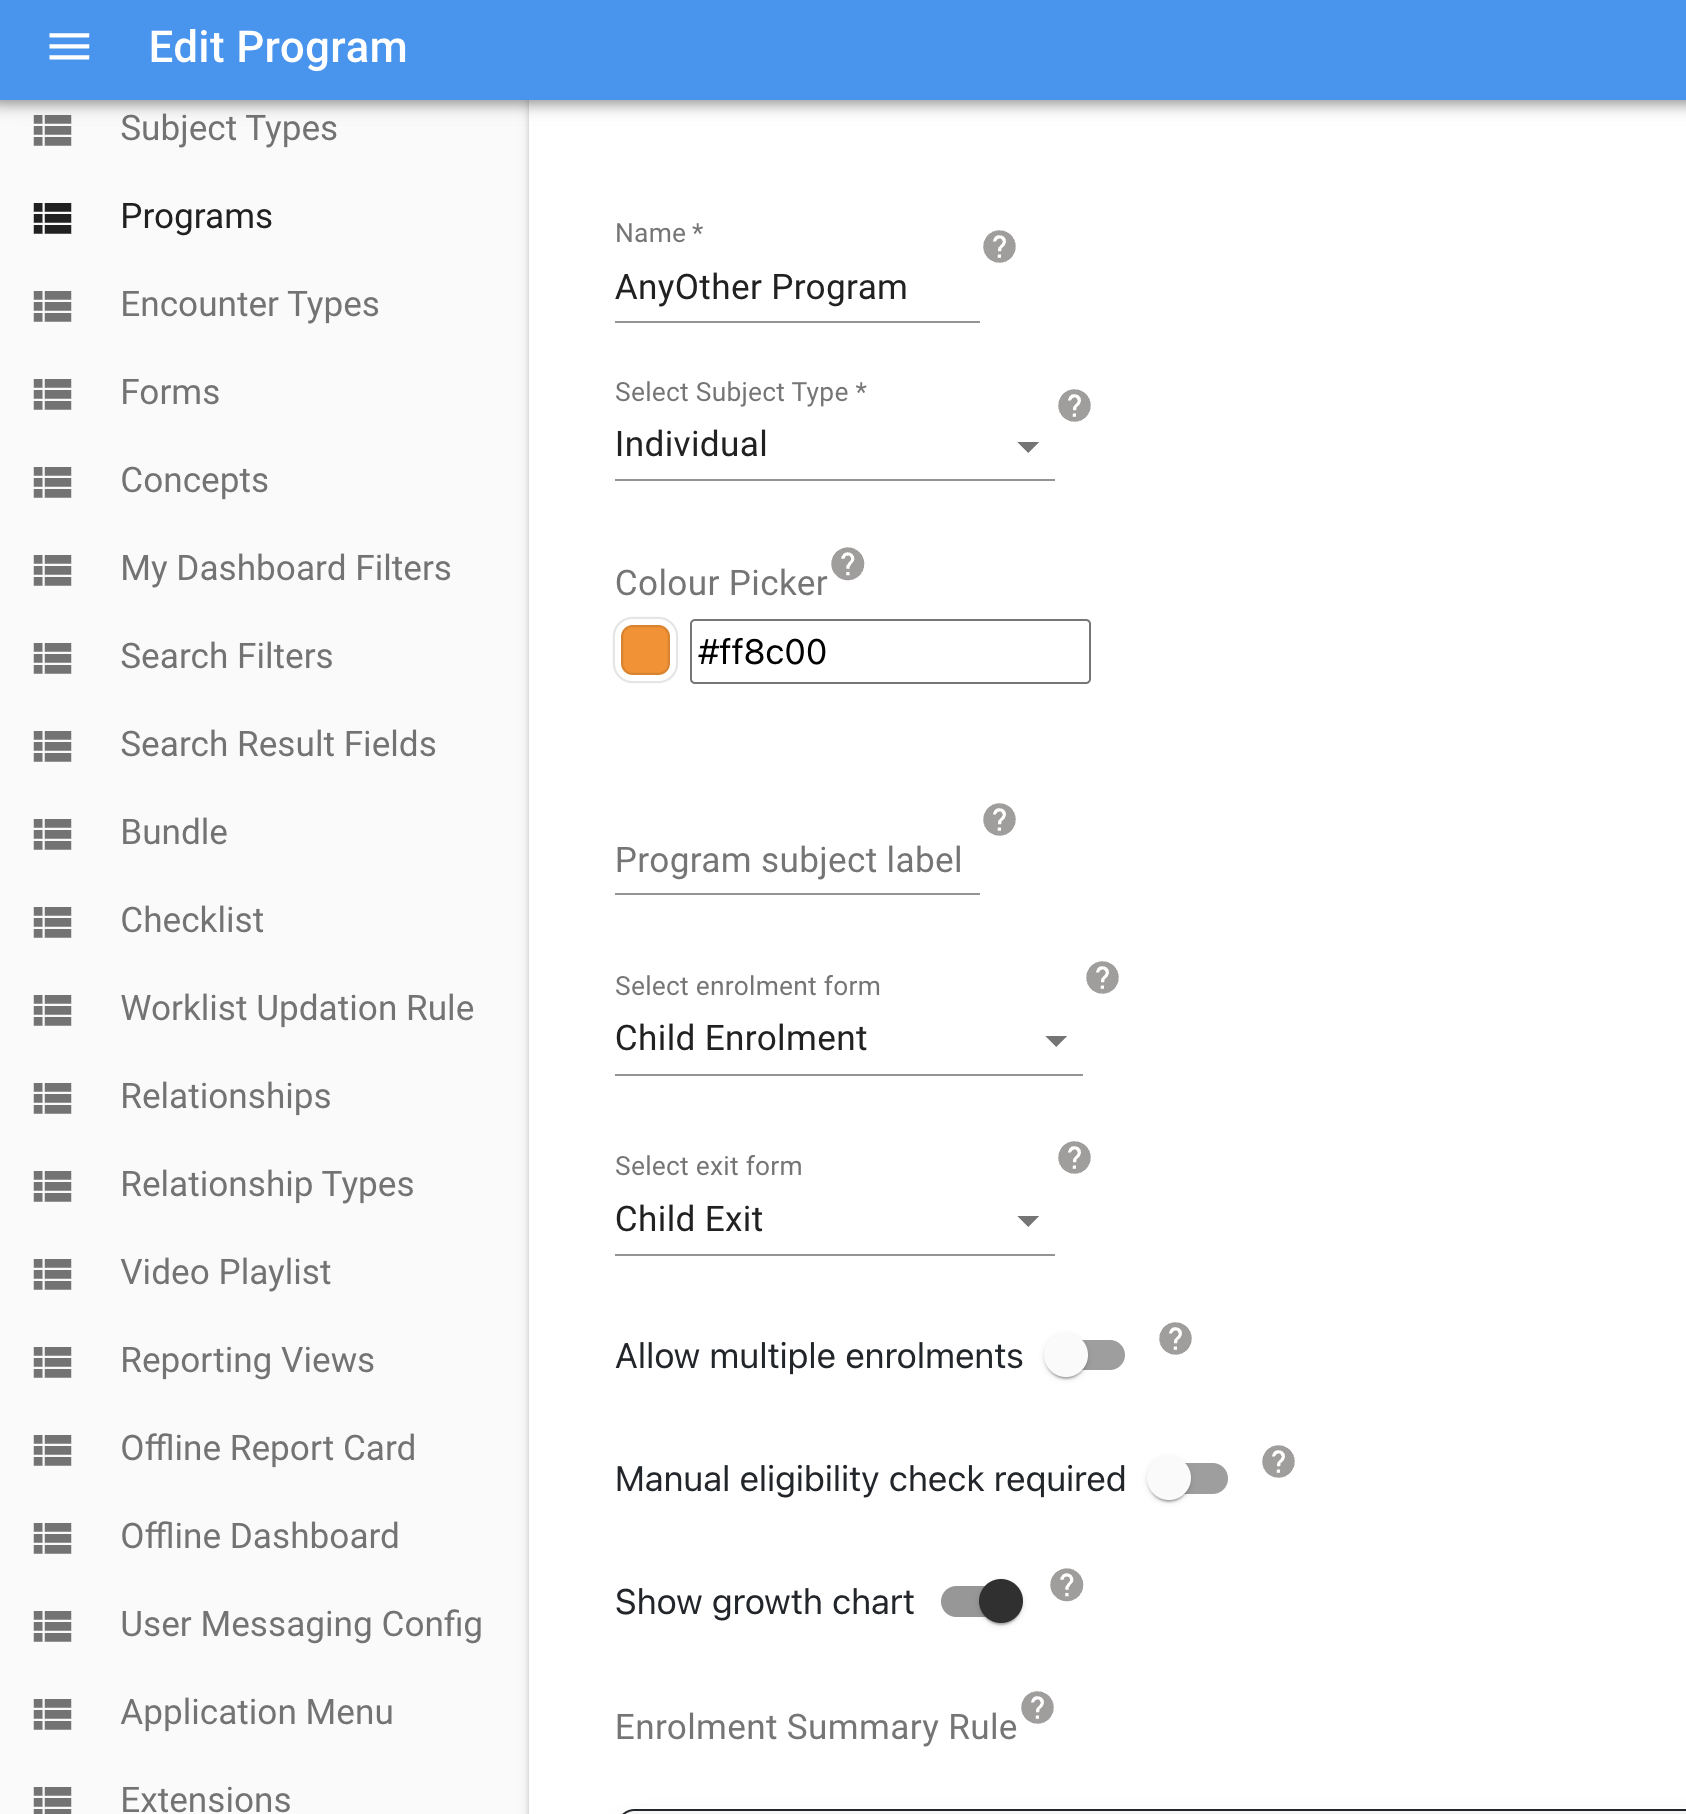
Required Configuration
It is essential for at least a few forms of the types listed below to include concepts with the names "Weight" and "Height". The values recorded for these concepts are then automatically used by the Avni application to plot the Growth Charts.
- Individual
- Program
- Program-Encounter
- Encounter
Accessing Growth Charts
Growth Charts are available only in the Avni Client application for:
- Individuals between ages 0 to 5 years AND
- Individuals enrolled in either a program named "Child" or "Phulwari" OR any other Program that has the "Show Growth Chart" widget enabled for it
For eligible children, a "Growth Chart" button will appear on the Program Dashboard.
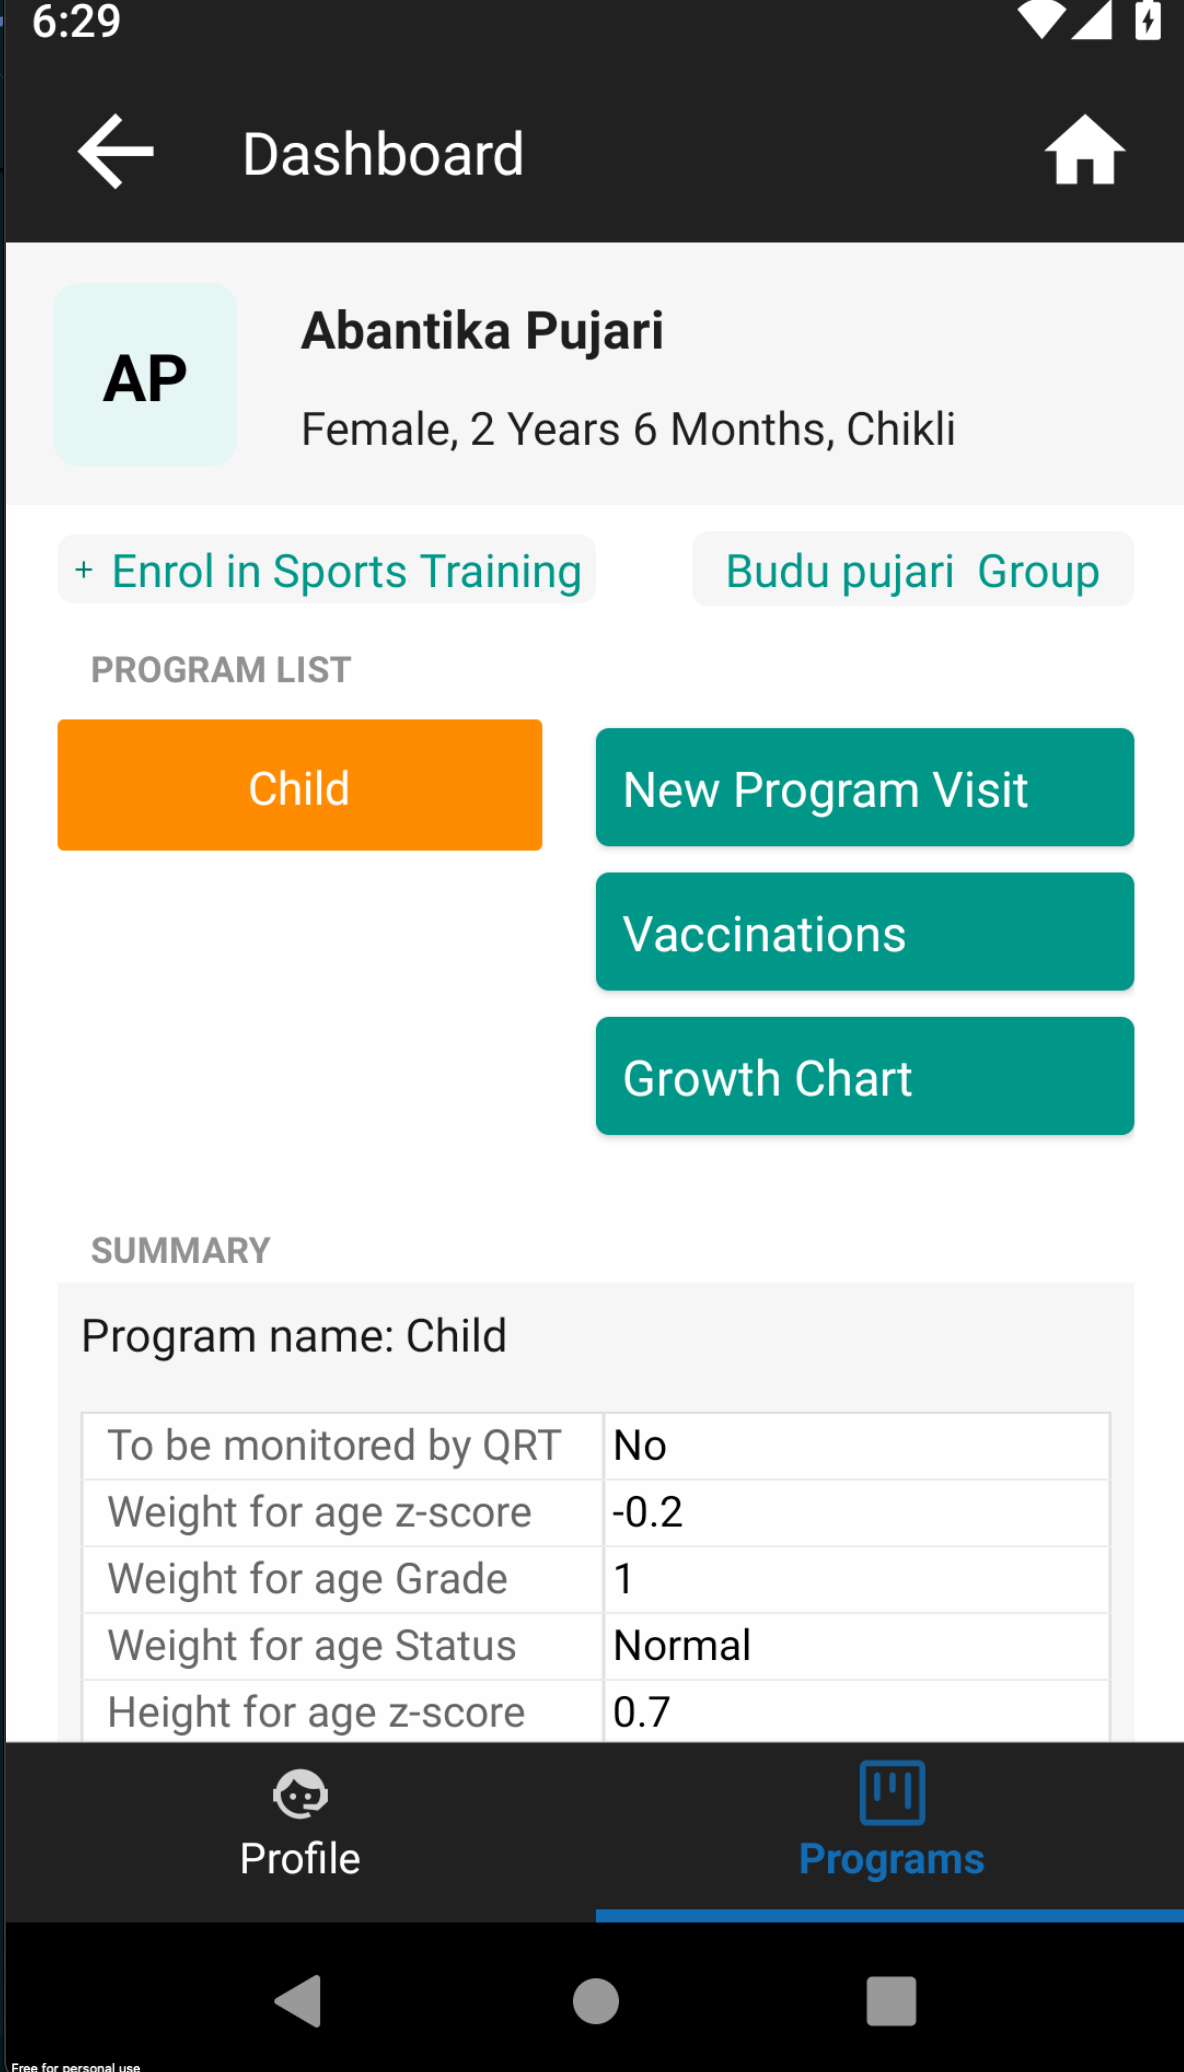
Screenshot showing the Growth Chart button on the Program Dashboard
Clicking the "Growth Chart" button displays the growth chart with selector buttons at the top, allowing users to choose which specific growth indicator to display for that child.
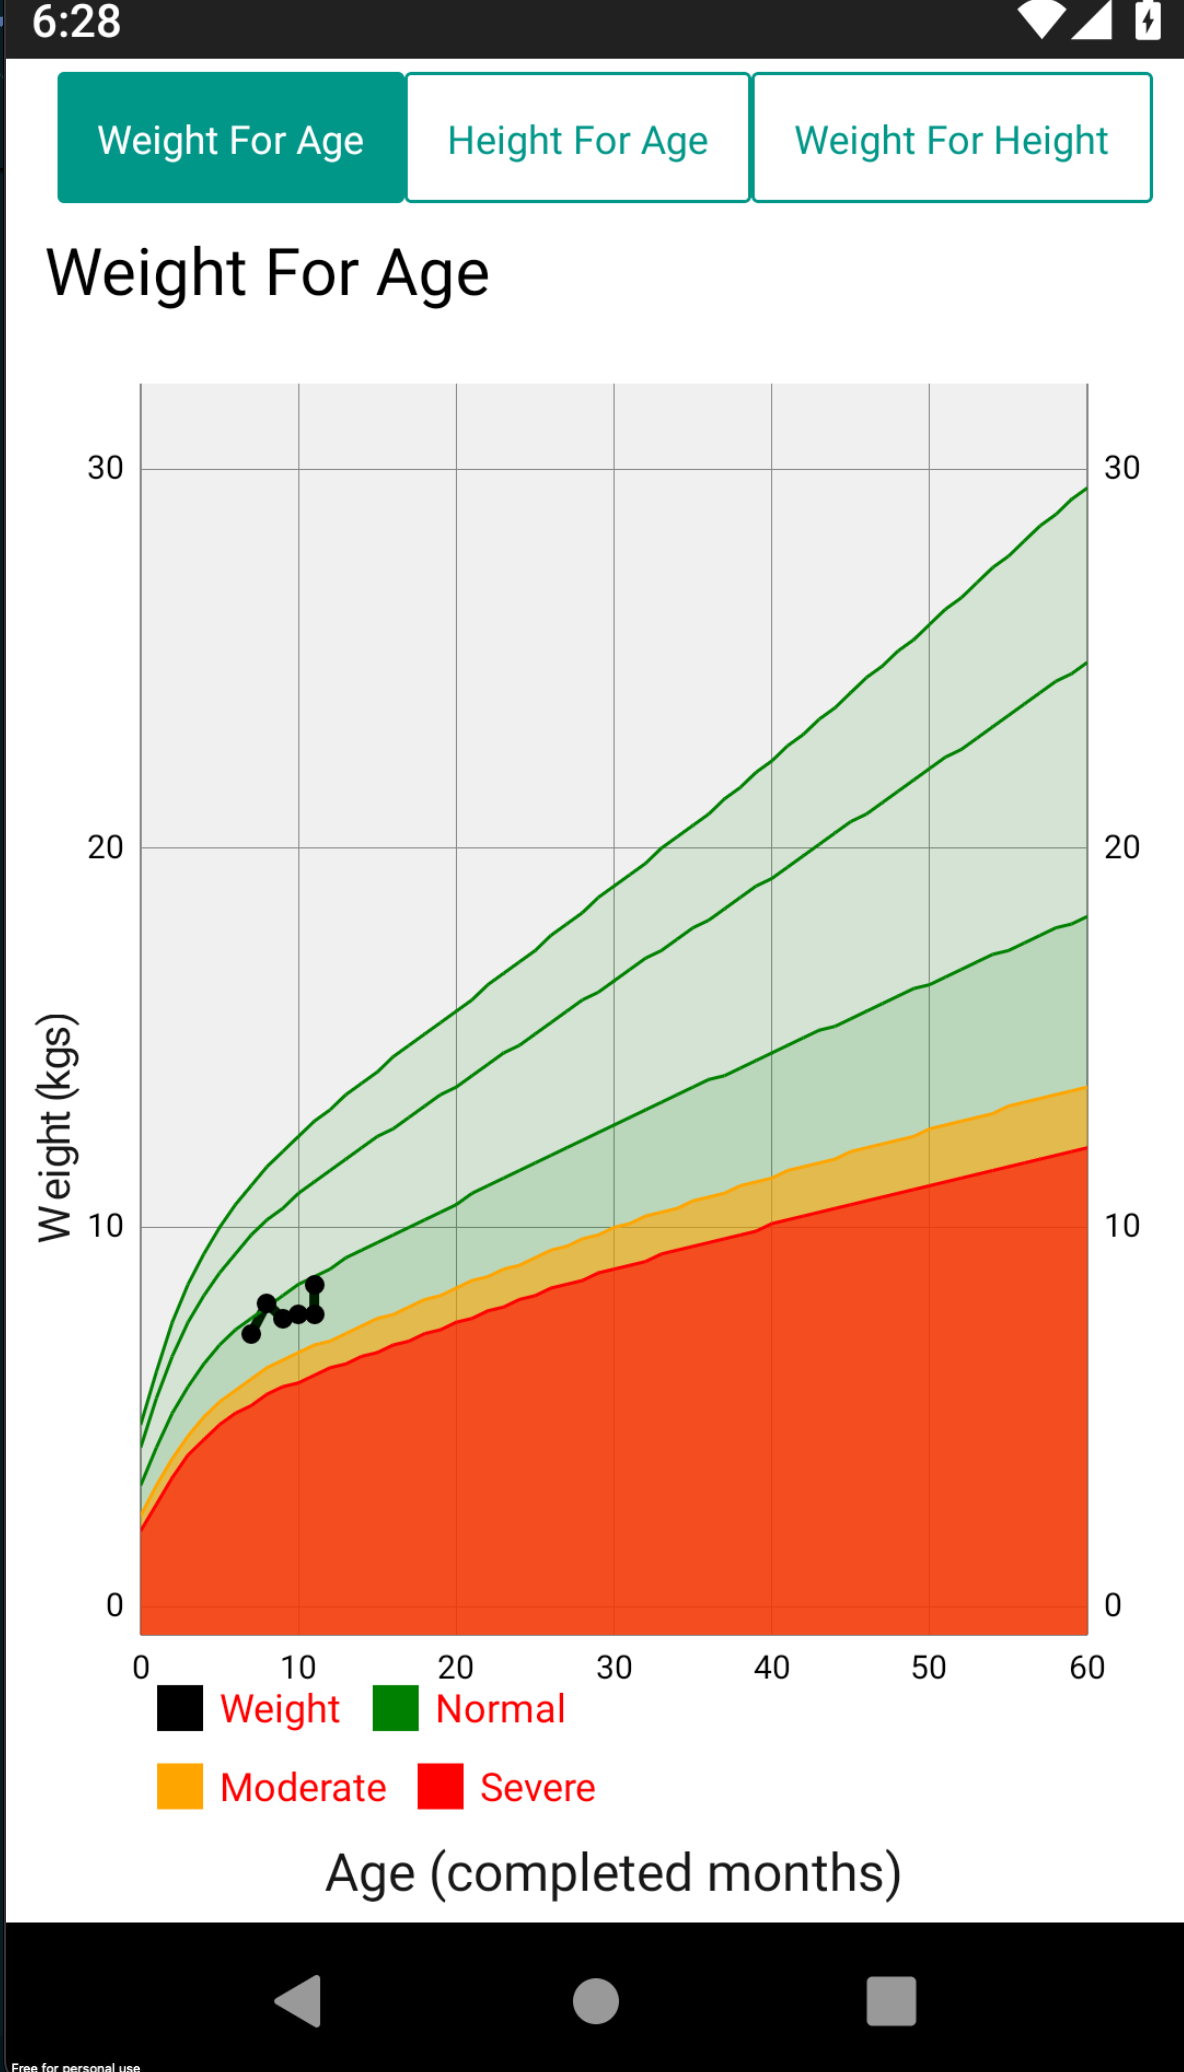
Screenshot of Weight-for-Age growth chart
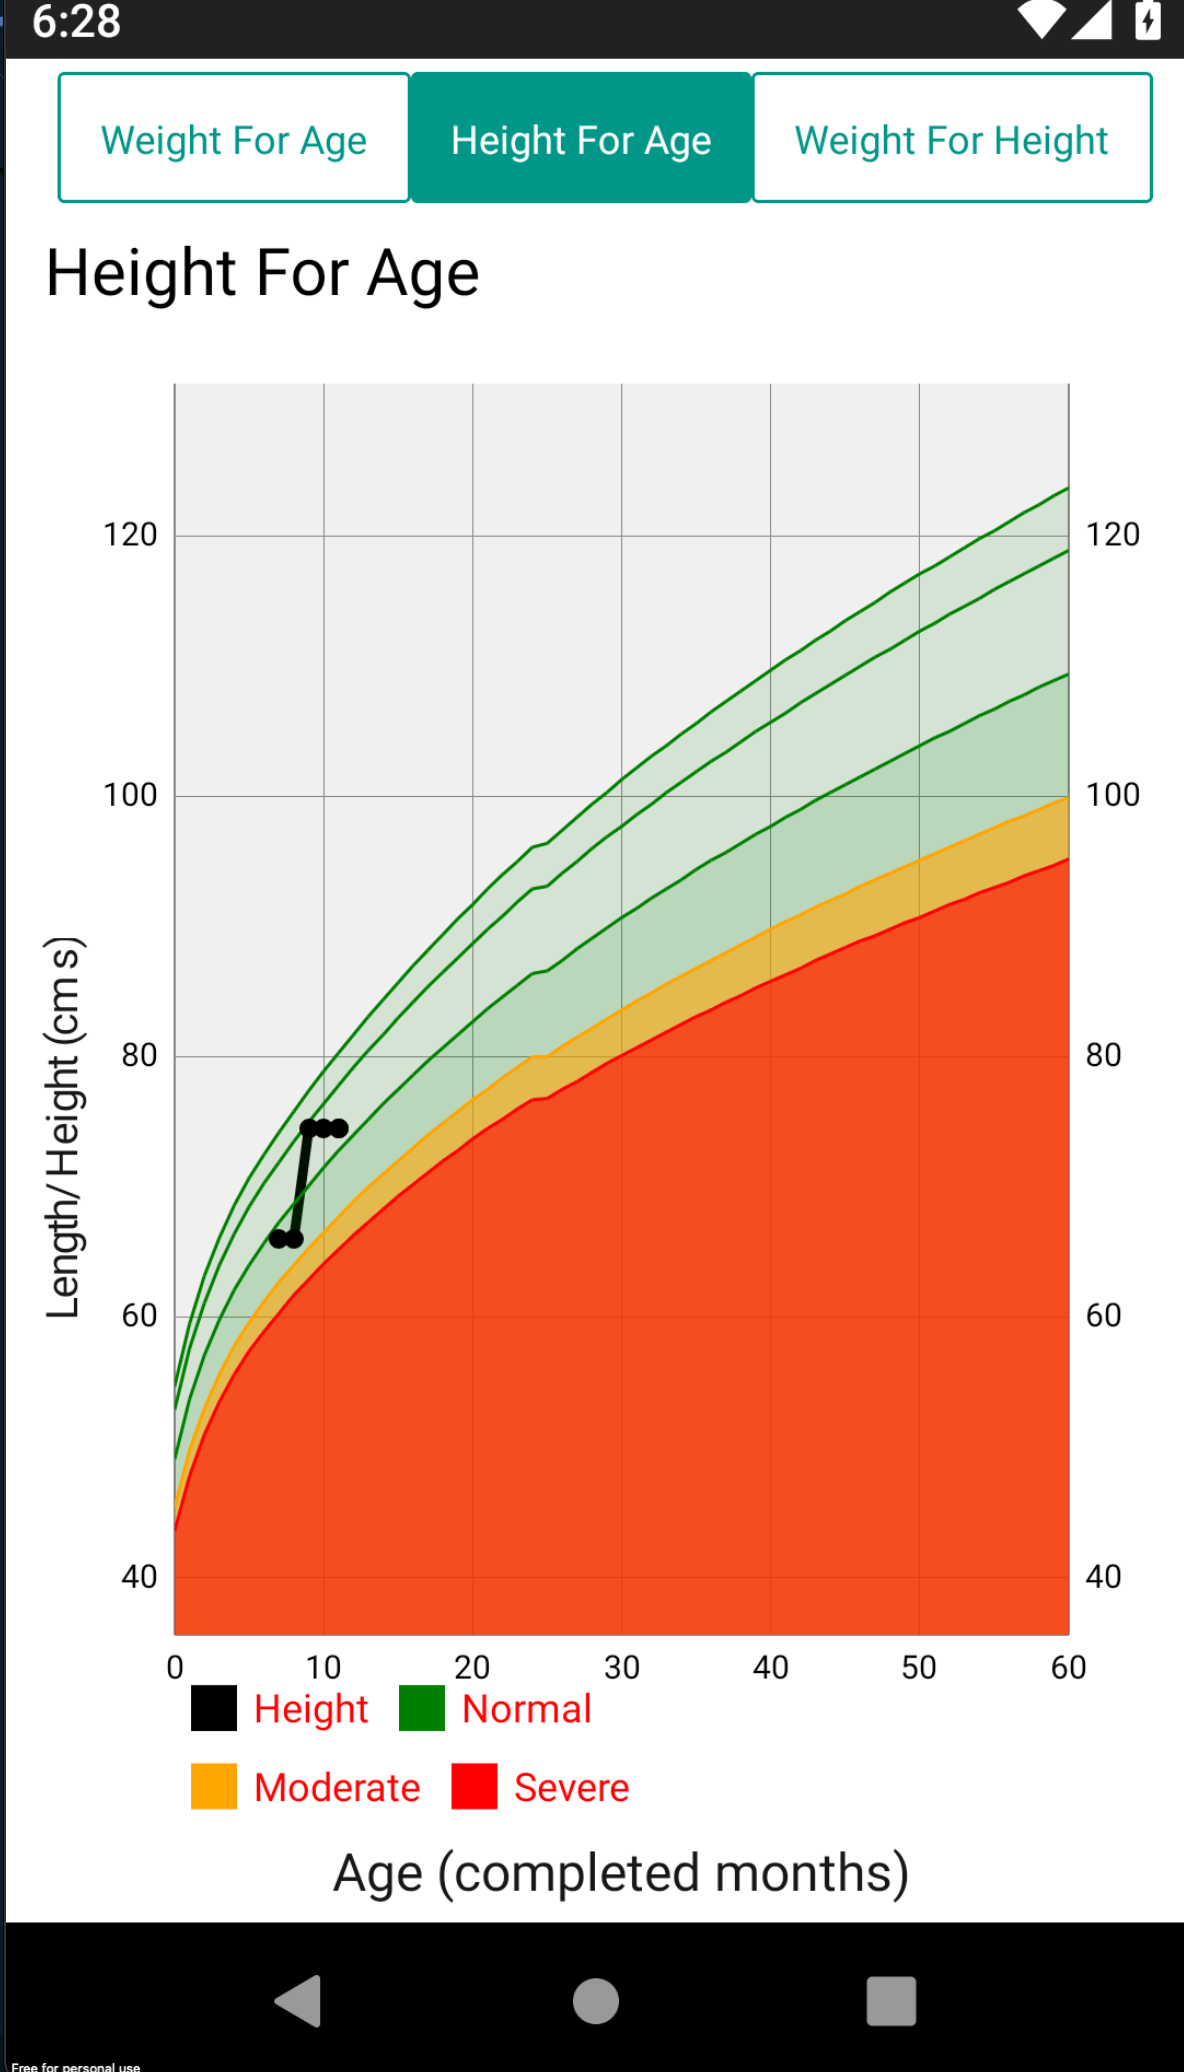
Screenshot of Height-for-Age growth chart
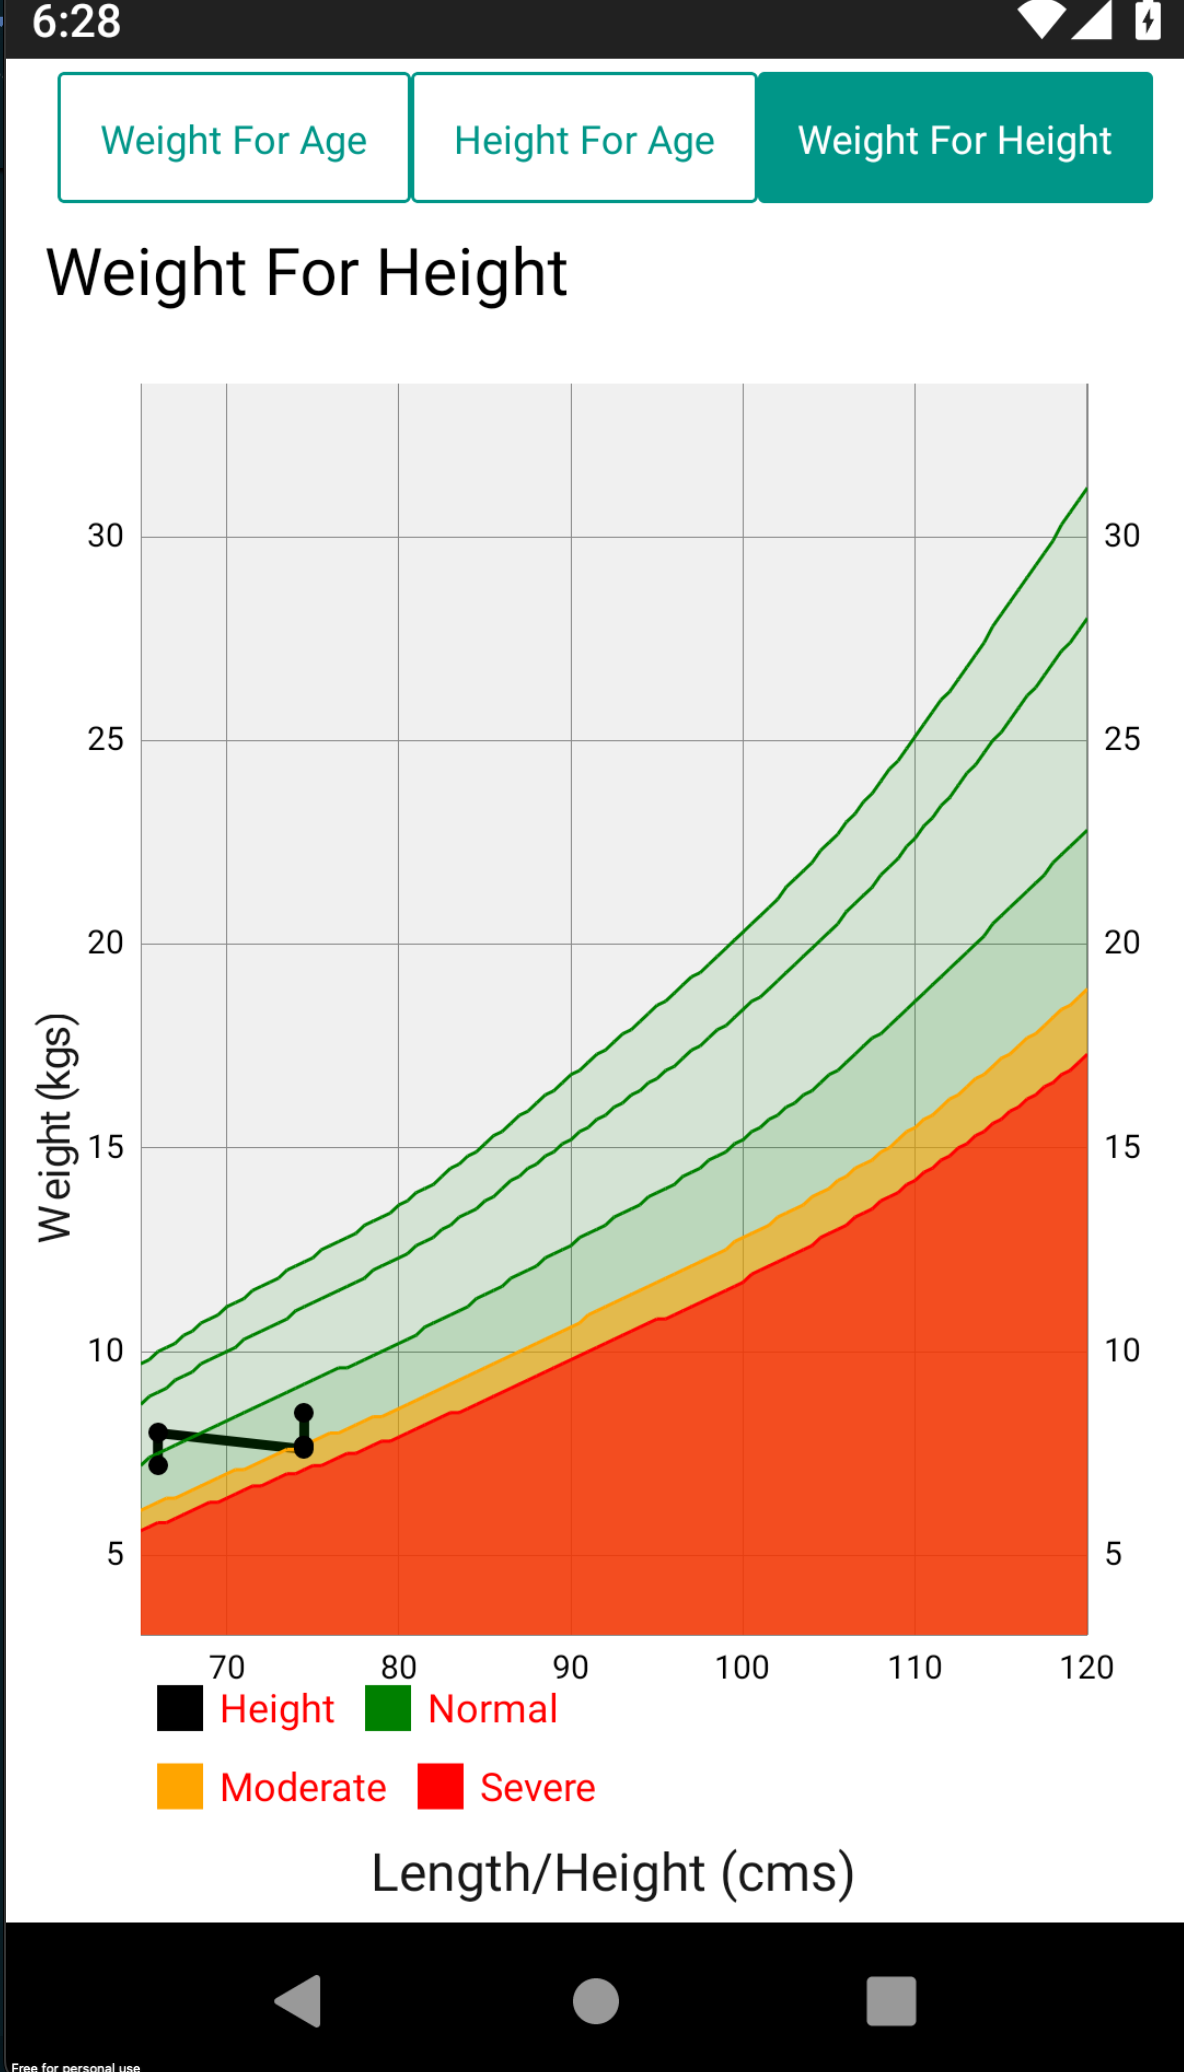
Screenshot of Weight-for-Height growth chart
Understanding Growth Charts
Chart Components
- Reference Lines: Standard deviation lines (typically -3SD, -2SD, -1SD, Median, +1SD, +2SD, +3SD) showing expected growth ranges based on WHO standards
- Data Points: Plotted points representing the individual's measurements at different ages
- Connecting Line: Line connecting the individual's data points to show growth trajectory
- X-Axis: Typically represents age in months/years
- Y-Axis: Represents the measurement value (weight, height, etc.)
Color Indicators
Growth Charts use color coding to help quickly identify growth status:
- Red Zone: Indicates measurements below -3SD (severe malnutrition or growth faltering)
- Yellow/Orange Zone: Indicates measurements between -2SD and -3SD (moderate malnutrition)
- Green Zone: Indicates measurements above -2SD (normal/healthy ranges)
Interpreting Growth Charts
When viewing a growth chart in Avni:
Weight-for-Age (WFA)
- Measures overall growth and can identify underweight children
- Below -2SD: Moderately underweight
- Below -3SD: Severely underweight
- Current Status: The position of the most recent data point relative to reference lines indicates current nutritional status
Height-for-Age (HFA)
- Measures linear growth and can identify stunting
- Below -2SD: Moderately stunted
- Below -3SD: Severely stunted
- Growth Trajectory: The direction of the connecting line shows if height growth is improving, maintaining, or declining
Weight-for-Height (WFH)
- Measures body weight relative to height and can identify wasting
- Below -2SD: Moderate wasting
- Below -3SD: Severe wasting
- Above +2SD: Overweight
- Above +3SD: Obese
- Pattern Recognition: Multiple data points help identify patterns like wasting or weight gain relative to height
Using Growth Chart Data for Interventions
Based on the growth chart visualization, field workers can:
-
Identify Growth Patterns:
- Normal growth: Data points consistently follow a growth channel
- Growth faltering: Flattening or downward trajectory of the curve
- Catch-up growth: Upward trajectory after a period of growth faltering
-
Take Appropriate Actions:
- Normal Growth: Continue regular monitoring and standard care
- Moderate Concerns (between -2SD and -3SD): Implement nutritional counseling and follow-up monitoring
- Severe Concerns (below -3SD): Refer for specialized care, nutritional interventions, or further assessment
Technical Implementation Details
- Growth charts are dynamically rendered based on recorded encounter data
- Charts require accurate recording of birth date and measurement values
- Reference data follows WHO Child Growth Standards
- Charts are available offline once data is synced to the device
- The implementation follows Avni's offline-first architecture, ensuring charts are available even without internet connectivity
- Data points are automatically plotted based on encounter data containing Weight and Height measurements
- Growth charts interface adapts to different screen sizes on mobile devices
Troubleshooting
If growth charts are not displaying correctly:
- Verify that concepts named exactly "Weight" and "Height" are included in encounter forms
- Ensure measurements are recorded in the correct units (kg for weight, cm for height)
- Confirm the child's date of birth is recorded accurately. Current implementation supports display of Growth Chart only for children aged 0-5 years
- Check that multiple encounters with measurements exist for proper trend visualization
- Sync your device to ensure you have the latest program configuration
- Verify that the program name is either "Child" or "Phulwari" to enable Growth Chart functionality automatically. For other programs, Growth Chart functionality can be enabled by toggling the "Show Growth Chart" widget to the Program Dashboard
Summary
Avni's Growth Chart functionality provides a powerful tool for field workers to monitor and assess child growth in accordance with WHO standards. The offline-first implementation ensures that these critical assessment tools are available even in areas with limited connectivity, aligning with Avni's core mission of supporting field workers in remote areas.
By following the simple configuration requirements and understanding how to interpret the charts, organizations can effectively track child growth and development, enabling timely interventions when needed.
Updated 11 months ago